
2020 Salary Survey data
After five years of anecdotally documenting salary discrepancies at organizations in the reproductive health, rights, and justice movement, we wanted to get more concrete salary data. Here are the results from what we believe is the first-ever (public!) movement-wide salary and benefits survey, and our accompanying public, anonymized salary table. Read our results below, and add your current and past salaries to the spreadsheet.
What are people in the reproductive health, rights, and justice (RH/RR/RJ) movement in the United States making? Does it differ by race? By region? We wanted to start to answer some of these questions, so we put together a survey and spread it far and wide. We hoped at least 100 people would answer, but over 500 did! While this survey isn’t generalizable, we hope it can ignite important conversations about equitable compensation and benefits in our field, support people in negotiating for better pay and benefits, and inspire some creative researchers to make the next version of this survey bigger and better.
Here are some of the results that stood out to us:
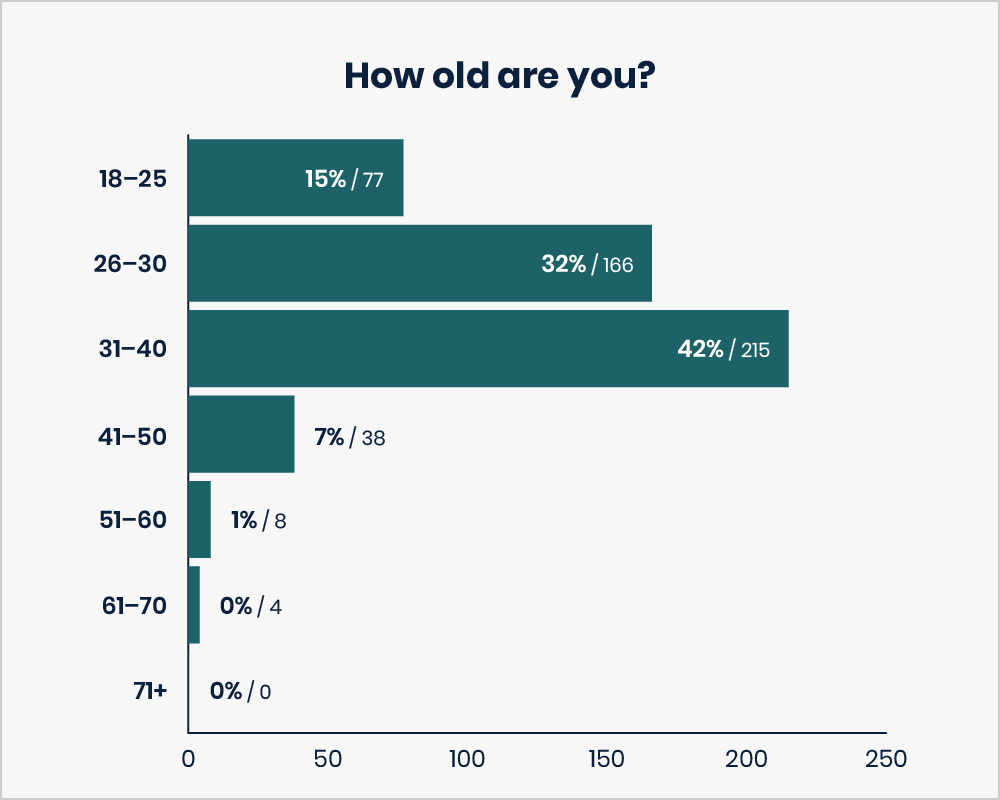
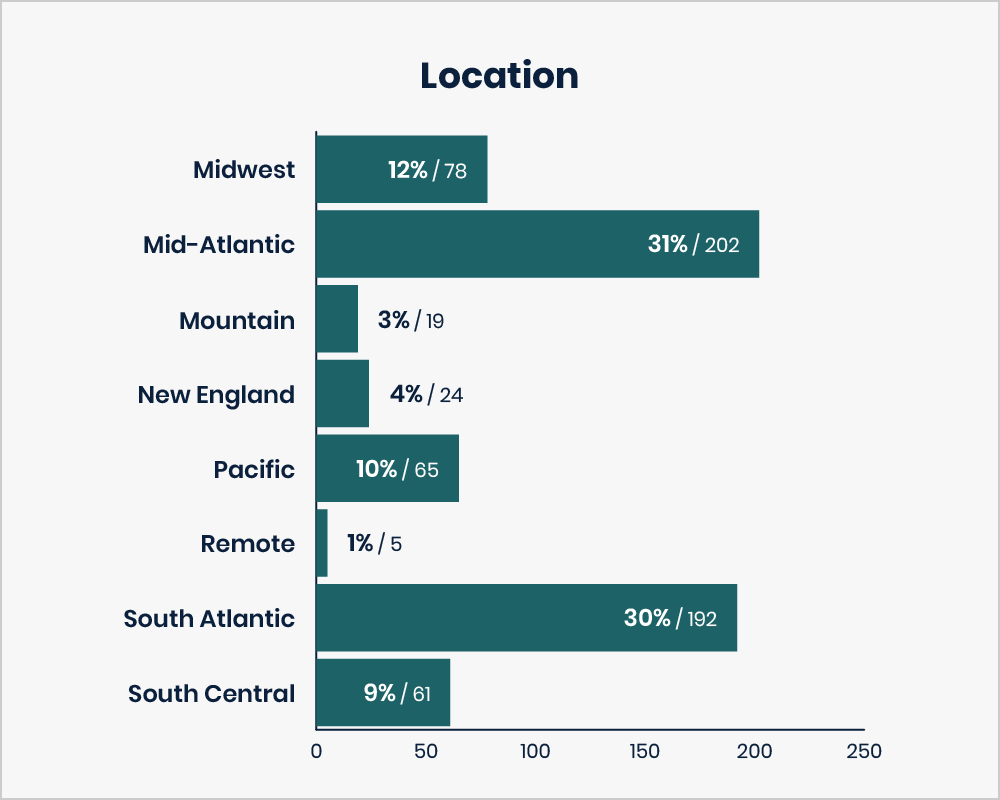
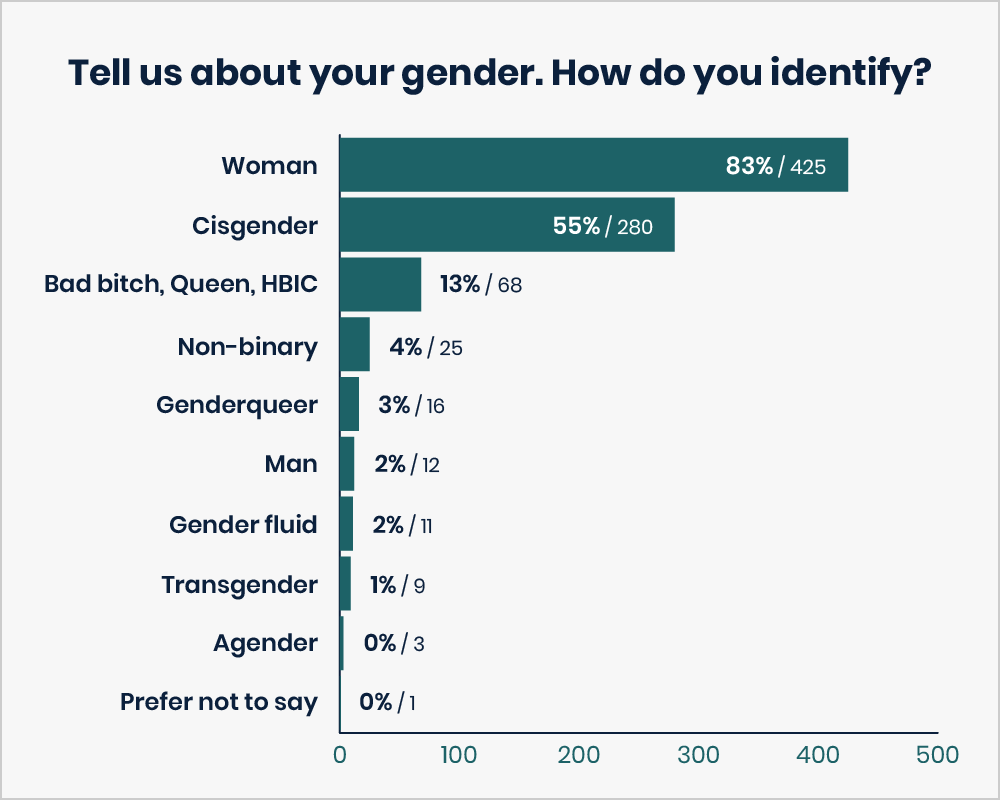
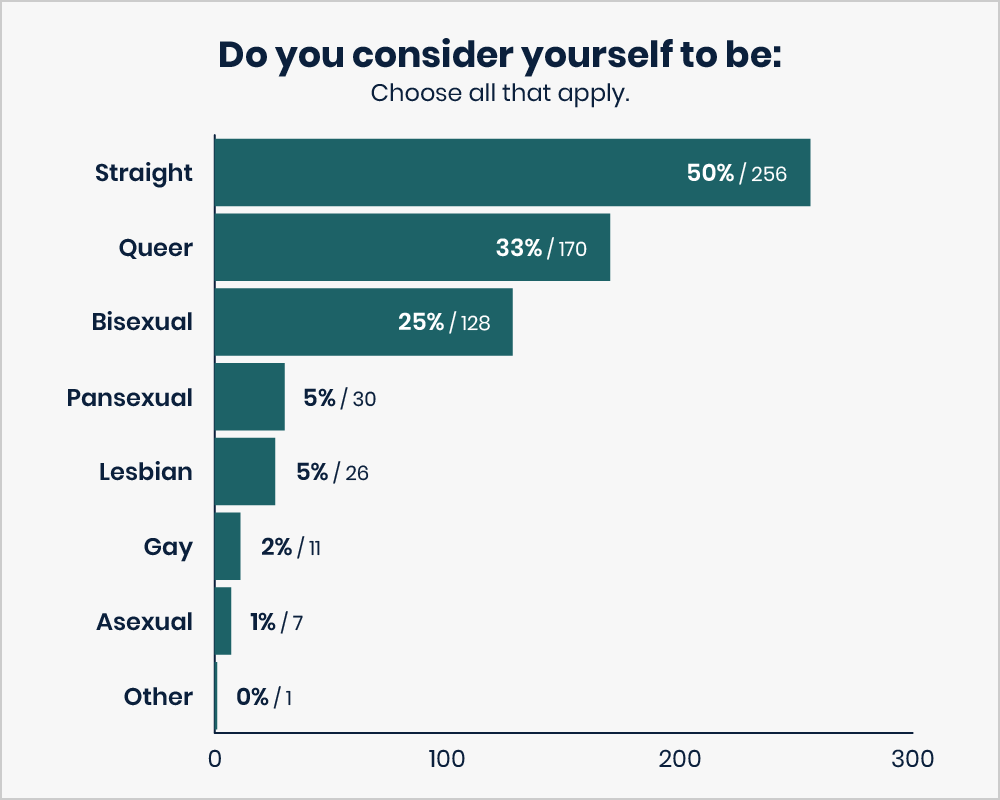
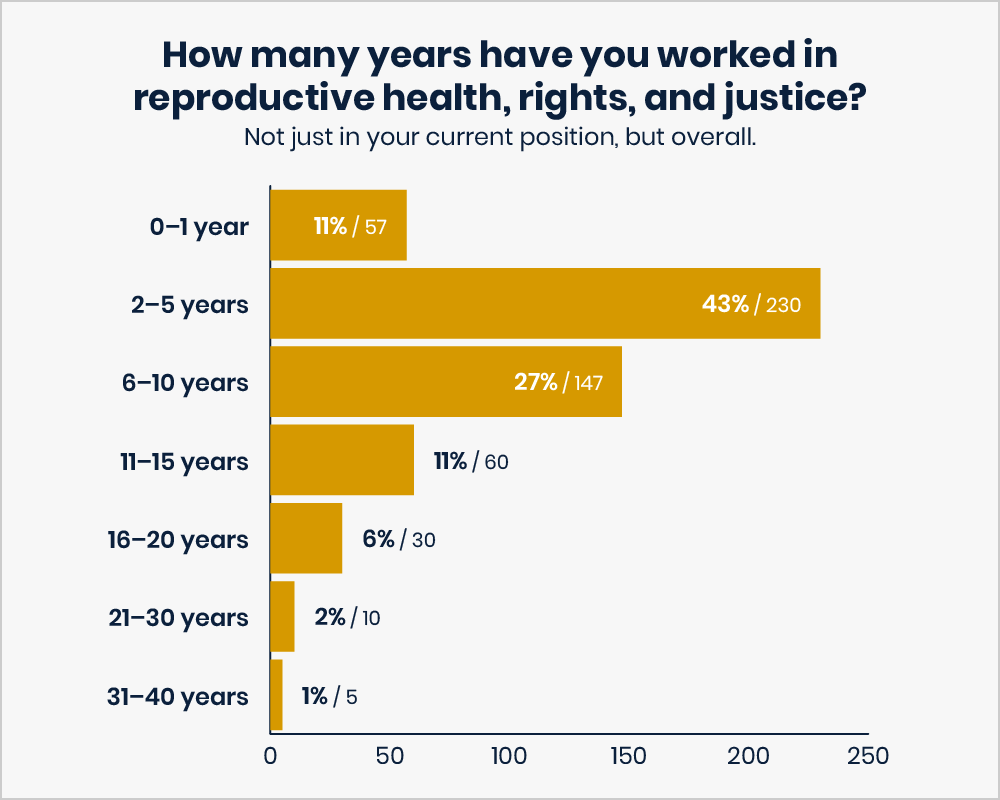
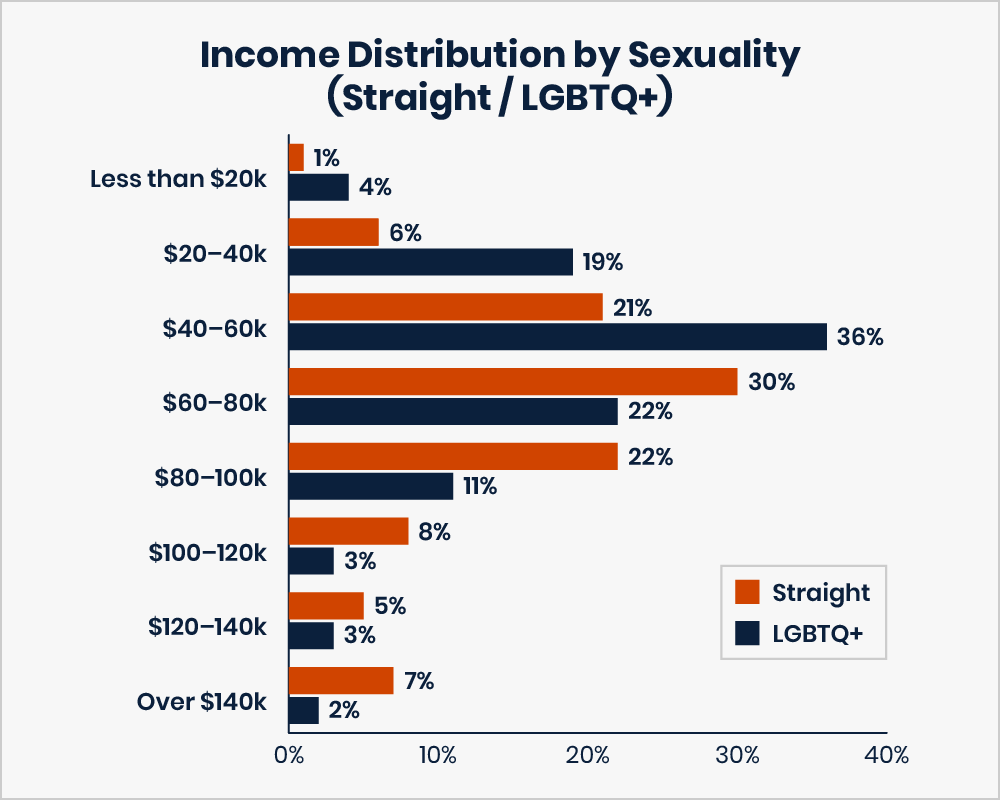
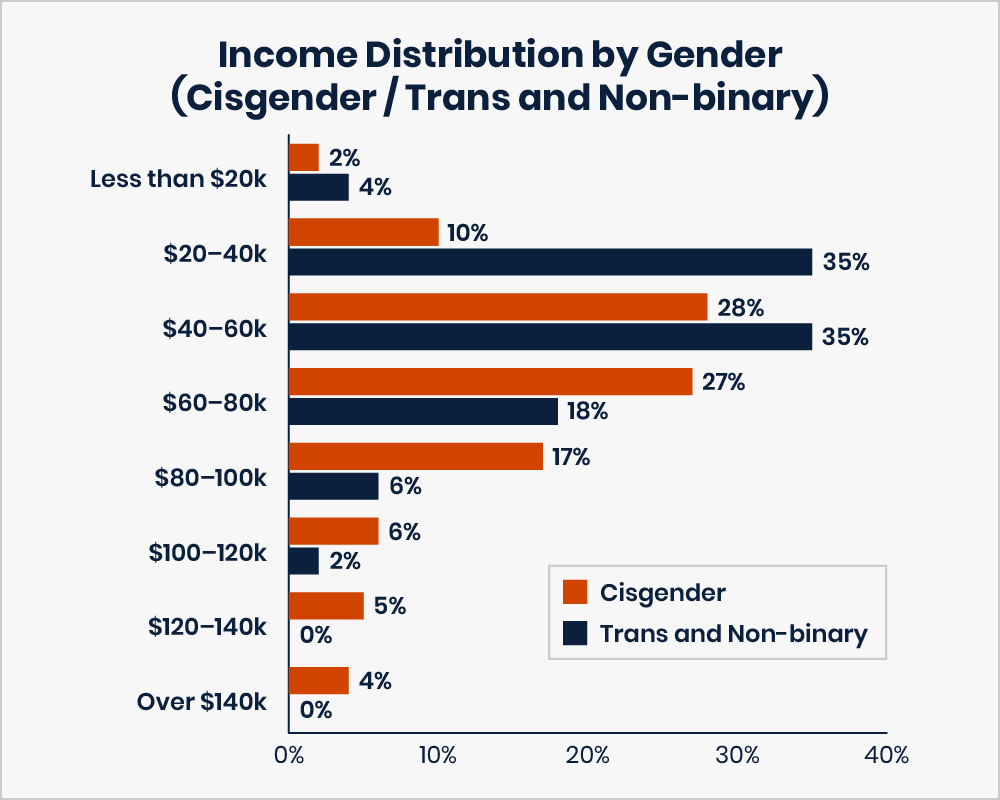
Respondents who have significantly higher salaries: live in the West, Northeast, and South; identify as straight; identify as (cisgender) women; are 31 years old or over, and have worked in RH/RR/RJ for five years or more.
Respondents who have significantly lower salaries: live in the Midwest, identify as LGBTQ+; identify as trans, genderqueer, genderfluid, or agender; are younger than 30, and have worked in the movement for less than 5 years.
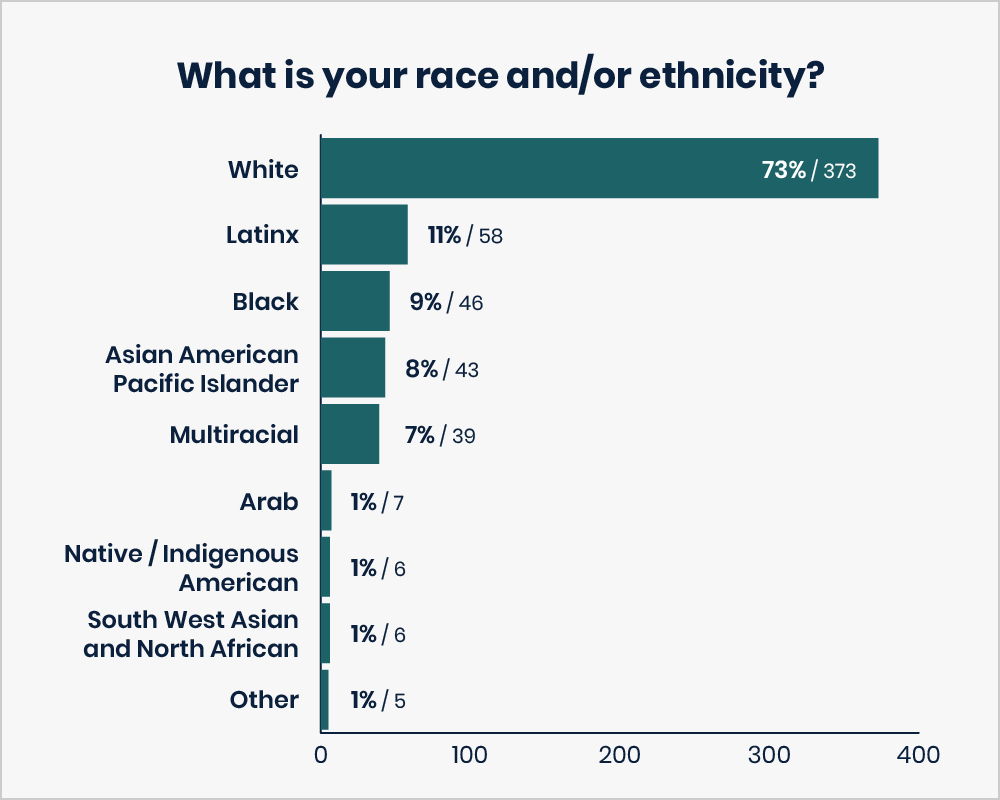
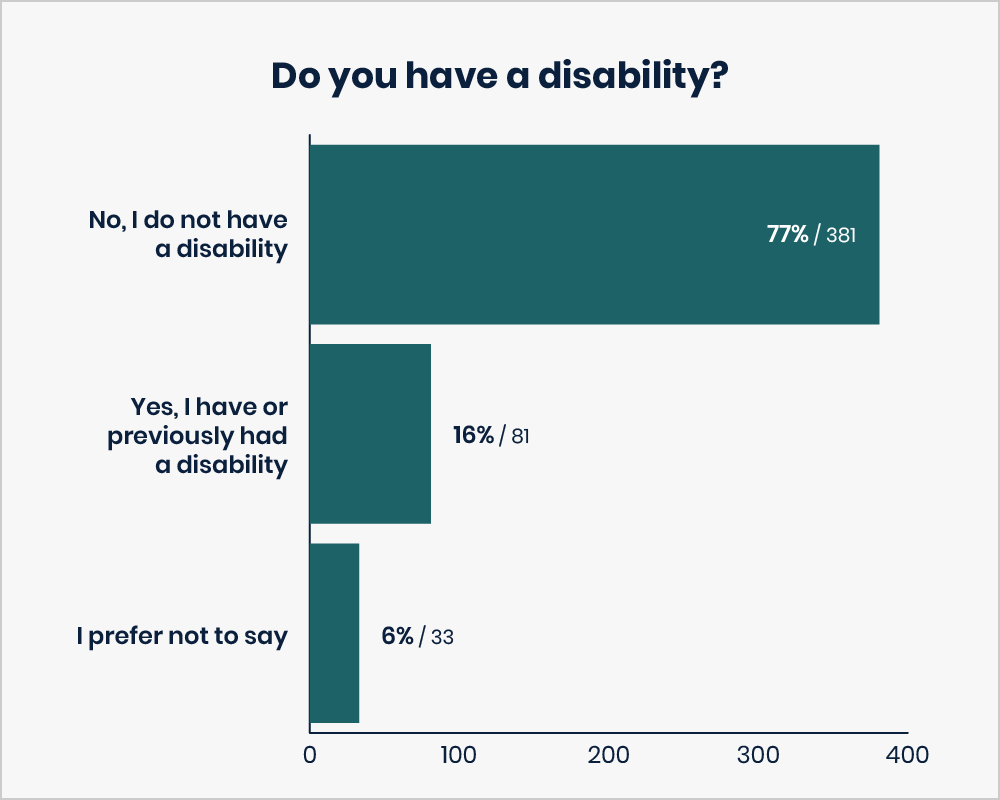
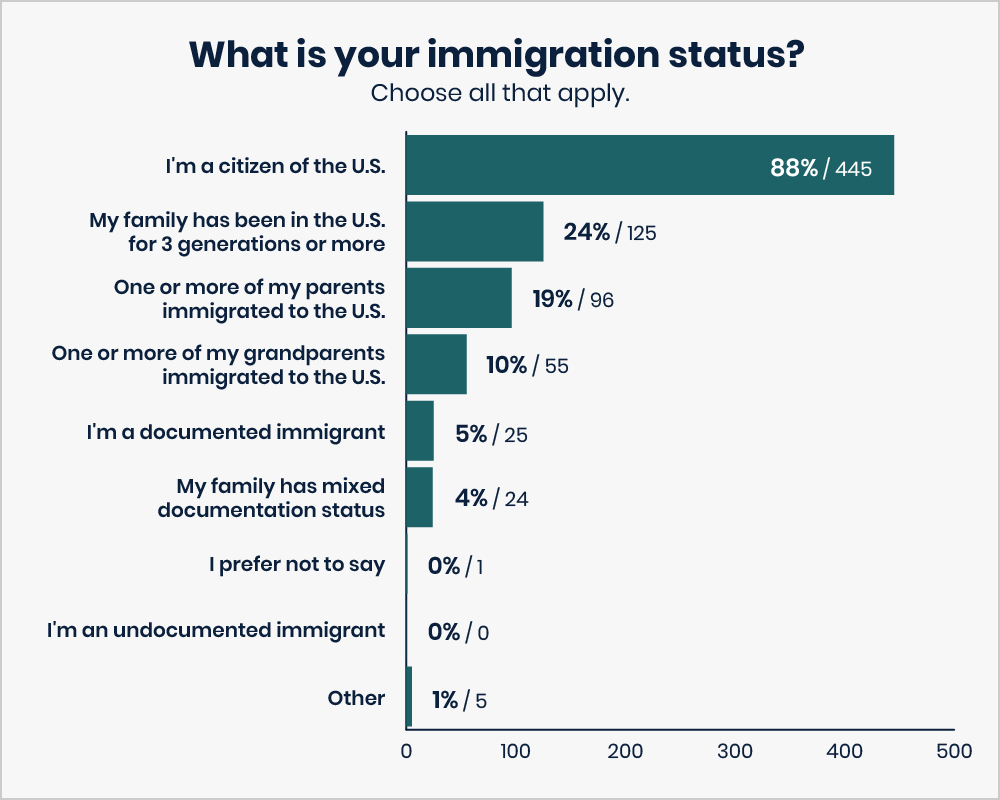
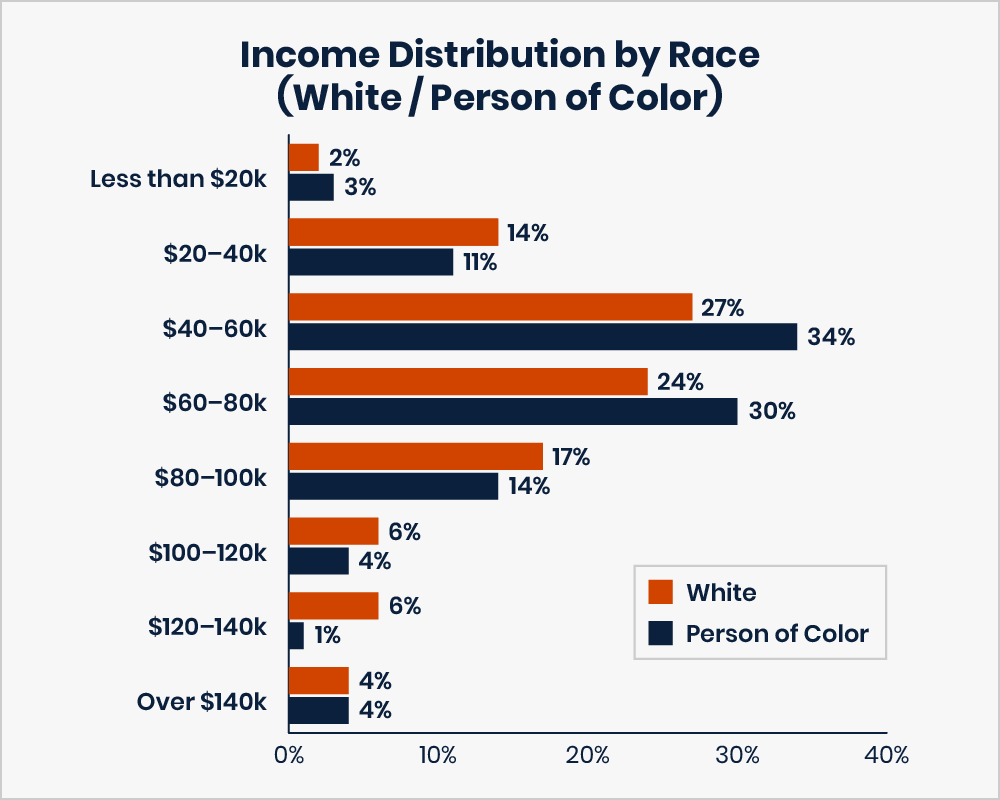
We know there are pay disparities based on race, and yet we found no difference in salaries by race/ethnicity. We also found no significant difference in salaries by disability status or and citizenship. This is likely because our sample was too small to detect these, and/or because of the way we asked the questions.
Respondents who identify as people of color are significantly more likely than white respondents to experience discrimination and harassment in the workplace. Respondents who identify as LGBTQ employees of color are significantly more likely to experience harassment than their white LGBTQ counterparts.
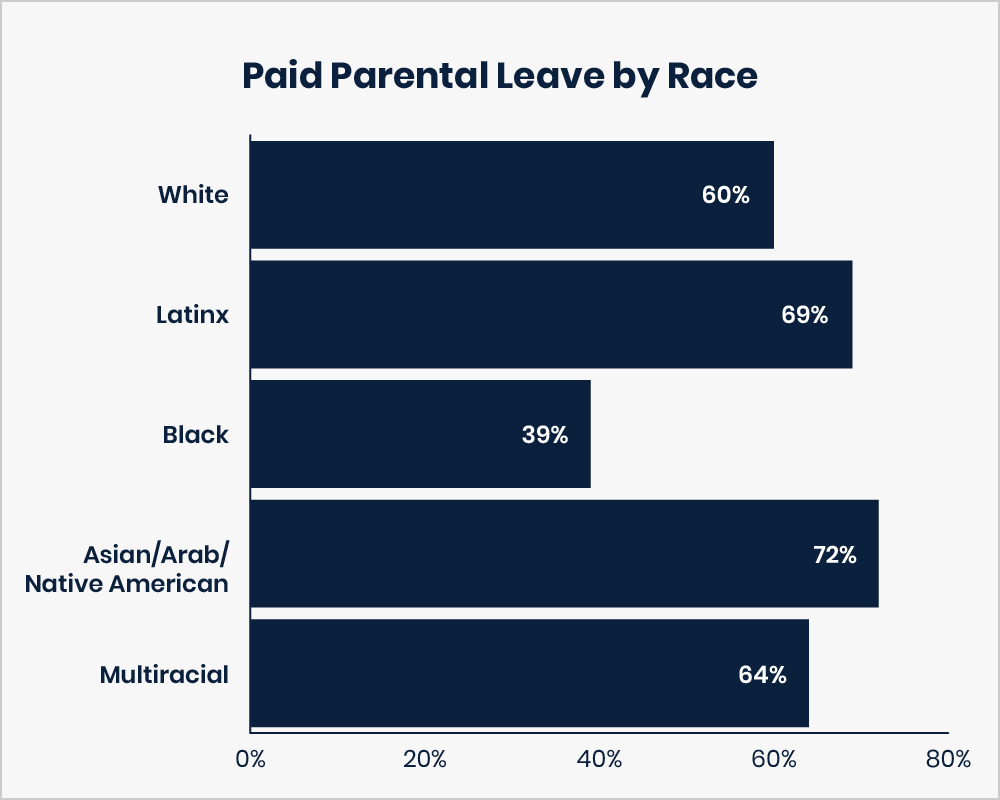
Some employee benefits differed significantly by respondent identity: white respondents are more likely than people of color respondents to have a retirement plan. Black respondents are significantly less likely to report paid parental leave than respondents of other races/ethnicities. Trans and non-binary and LGBTQ+ respondents are significantly less likely than straight and cisgender respondents to report receiving a number of benefits.
Demographics
- Race/Ethnicity
- Age
- Location
- Gender
- Sexuality
- Disability Status
- Immigration Status
Job Characteristics
- Employment Status
- Years in the field
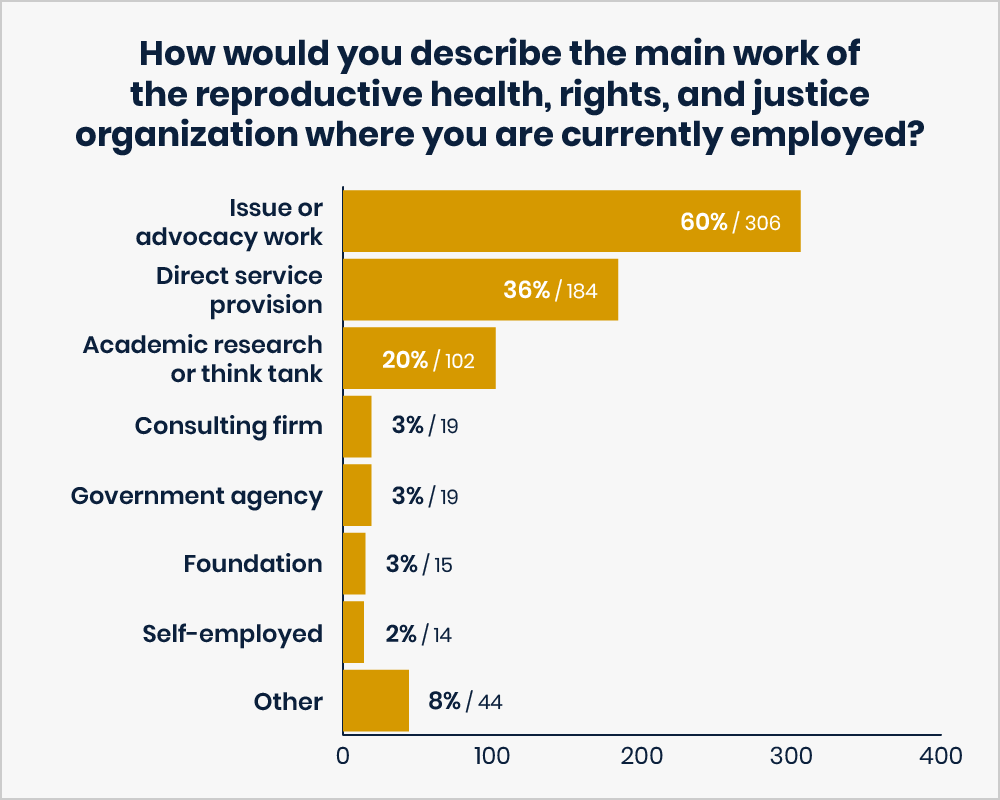
- Job Type
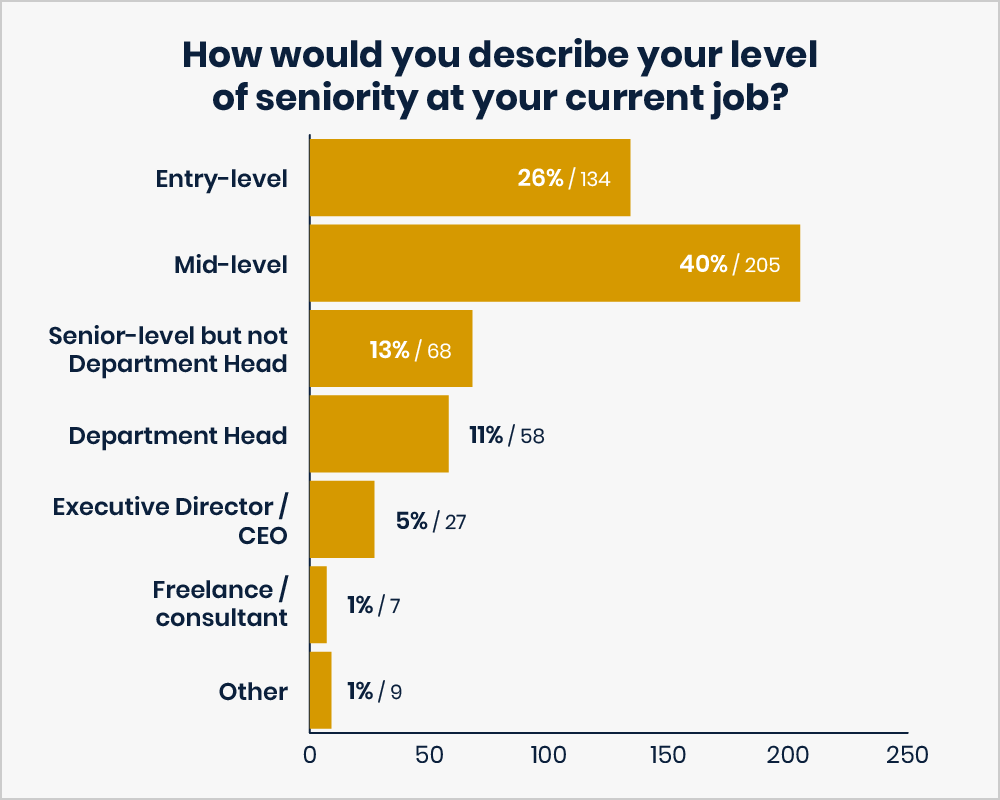
- Seniority

Salaries
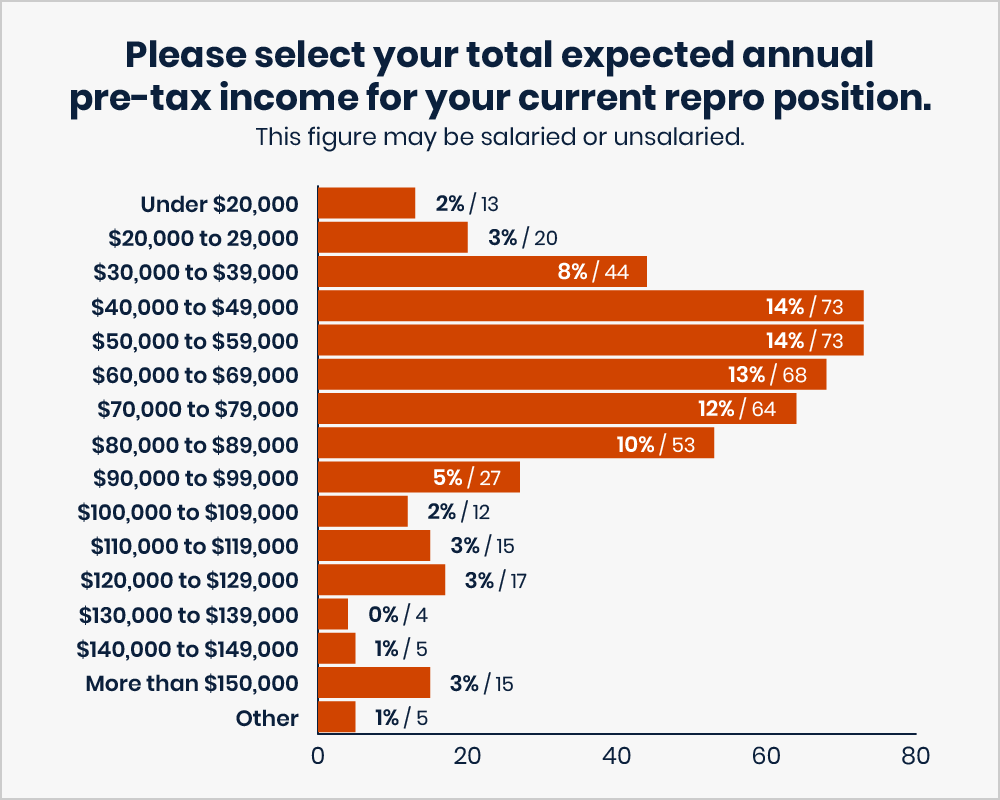
- Income
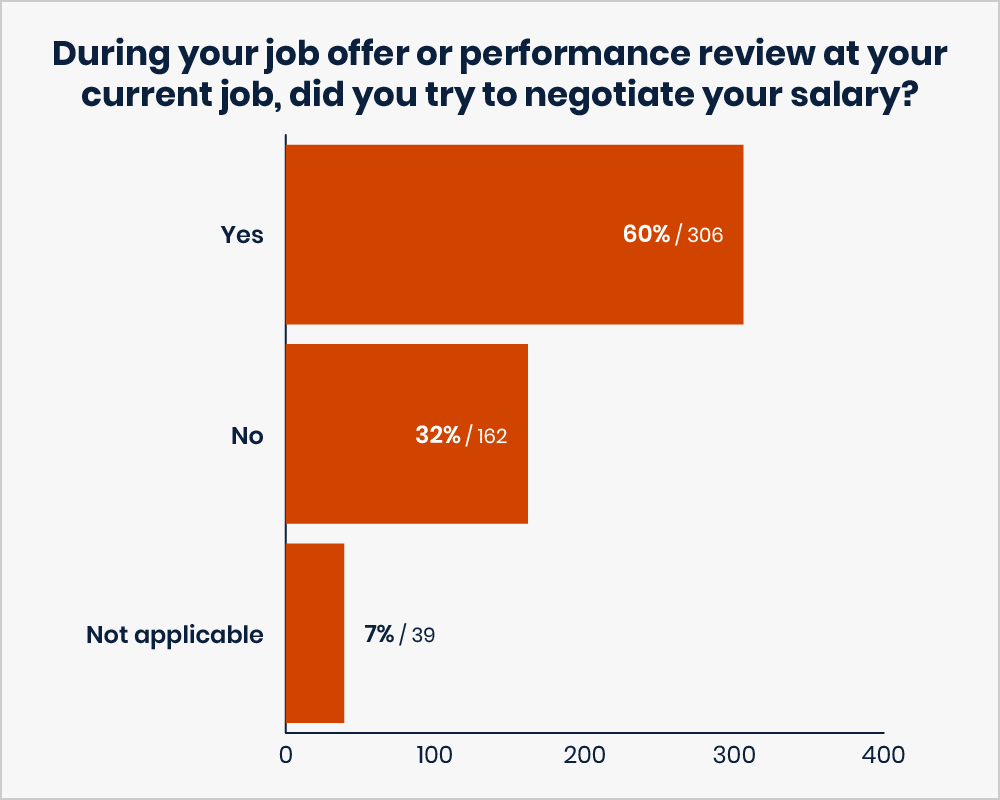
- Salary Negotiation
- Negotiation Success

- Income Distribution by Race
- Income Distribution by Sexuality
- Income Distribution by Gender
Benefits
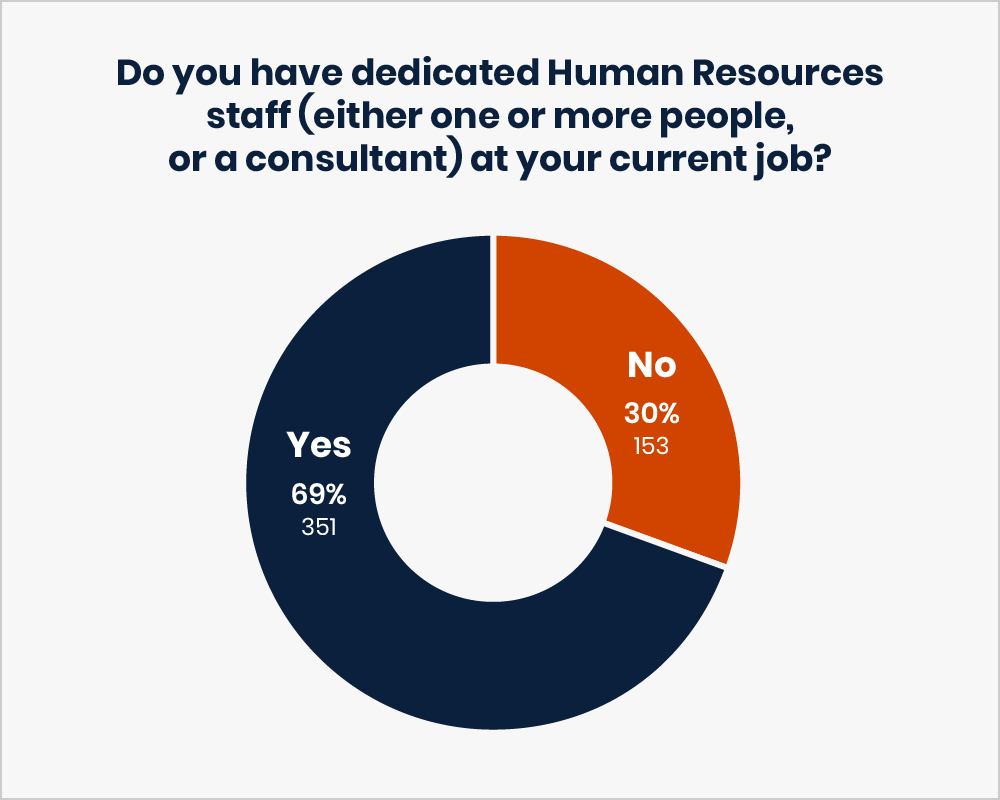
- HR Staff
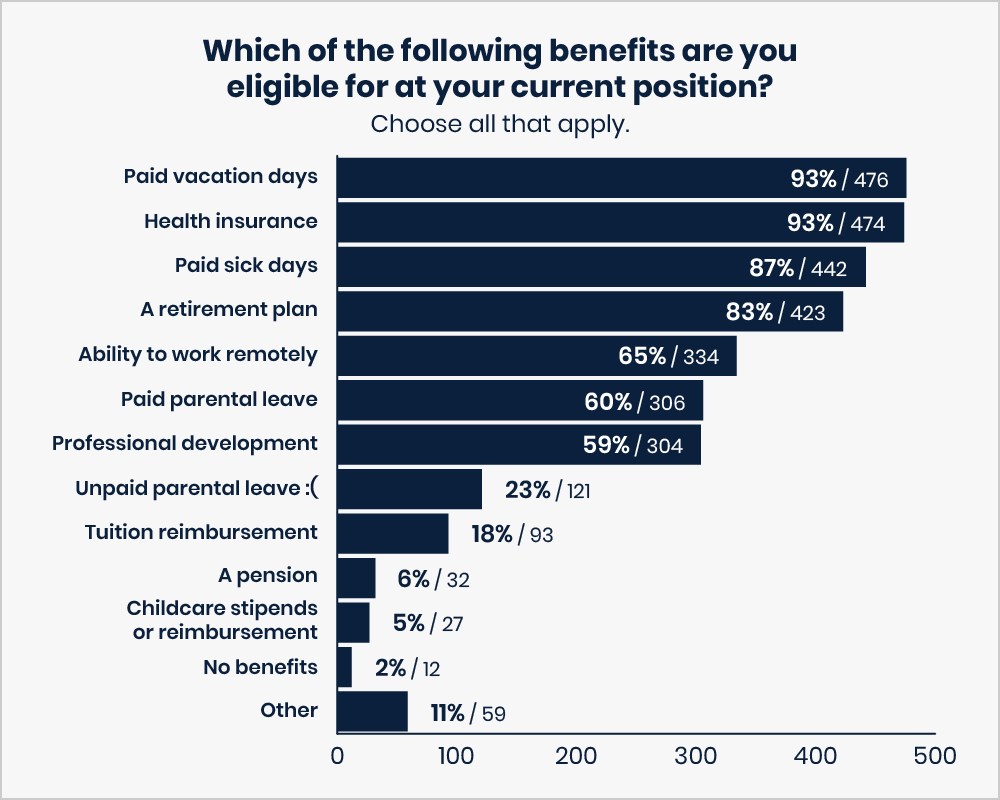
- All Benefits
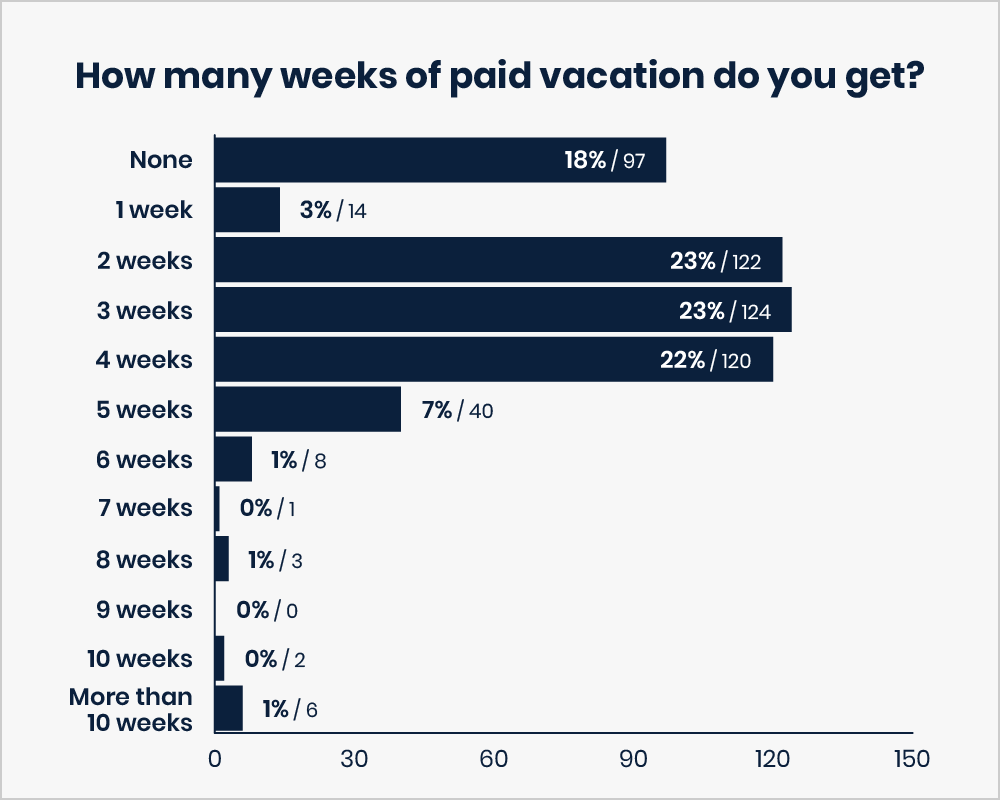
- Paid Vacation
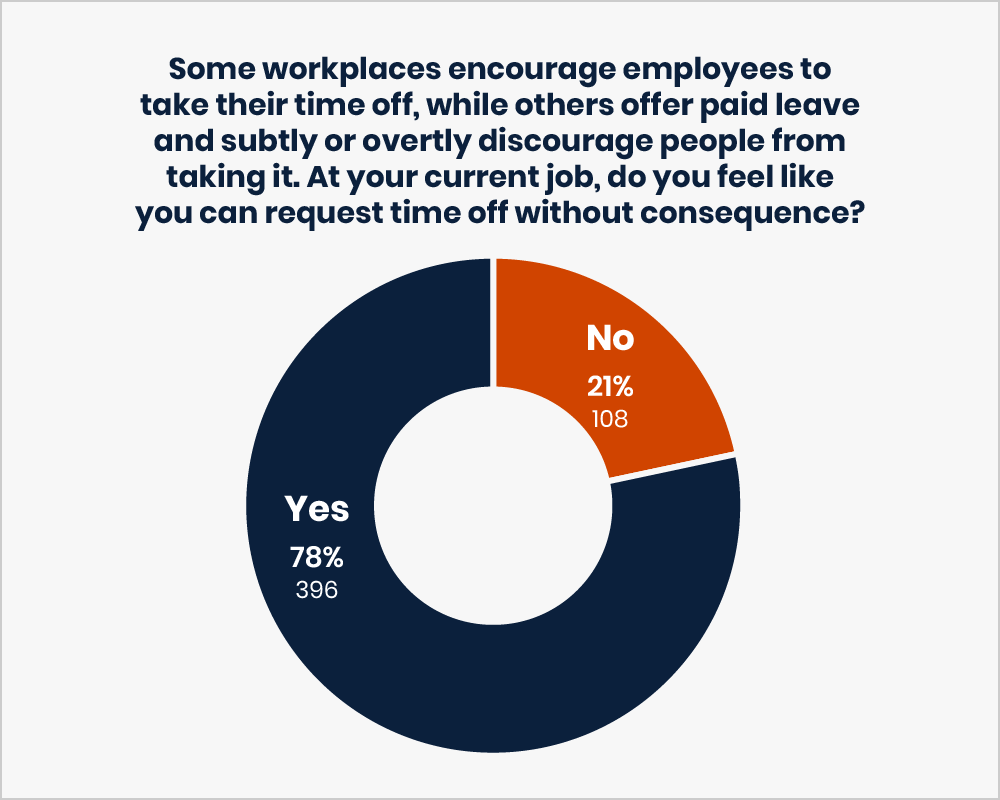
- Encouraged to take time off?
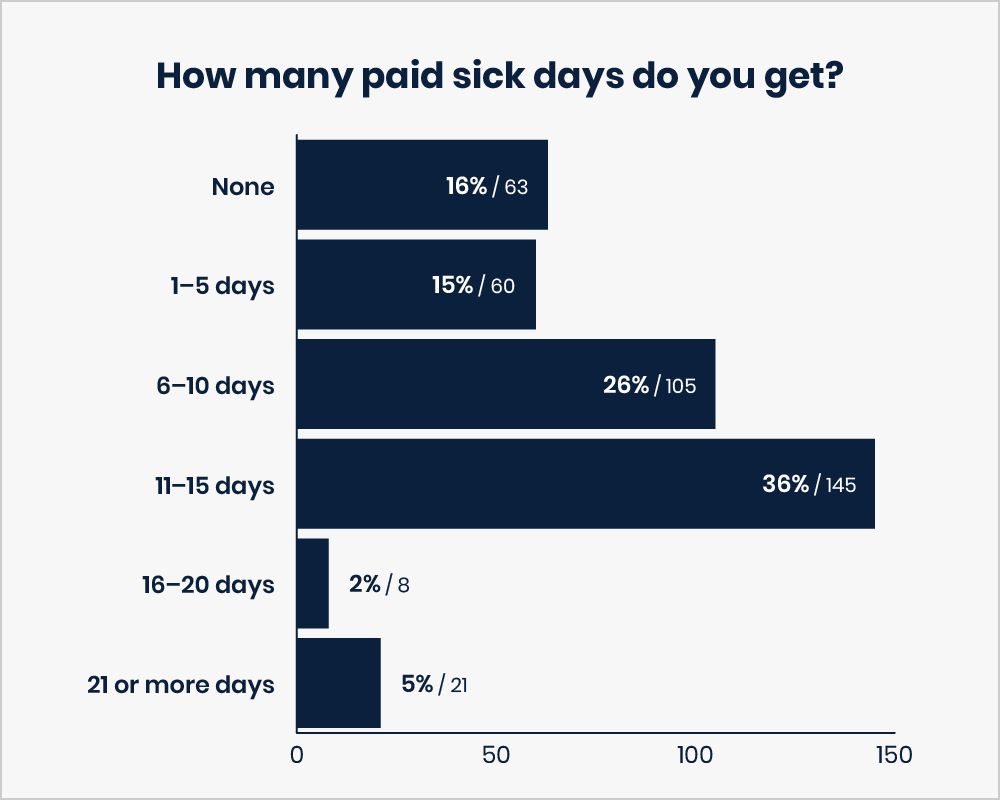
- # of Paid Sick Days
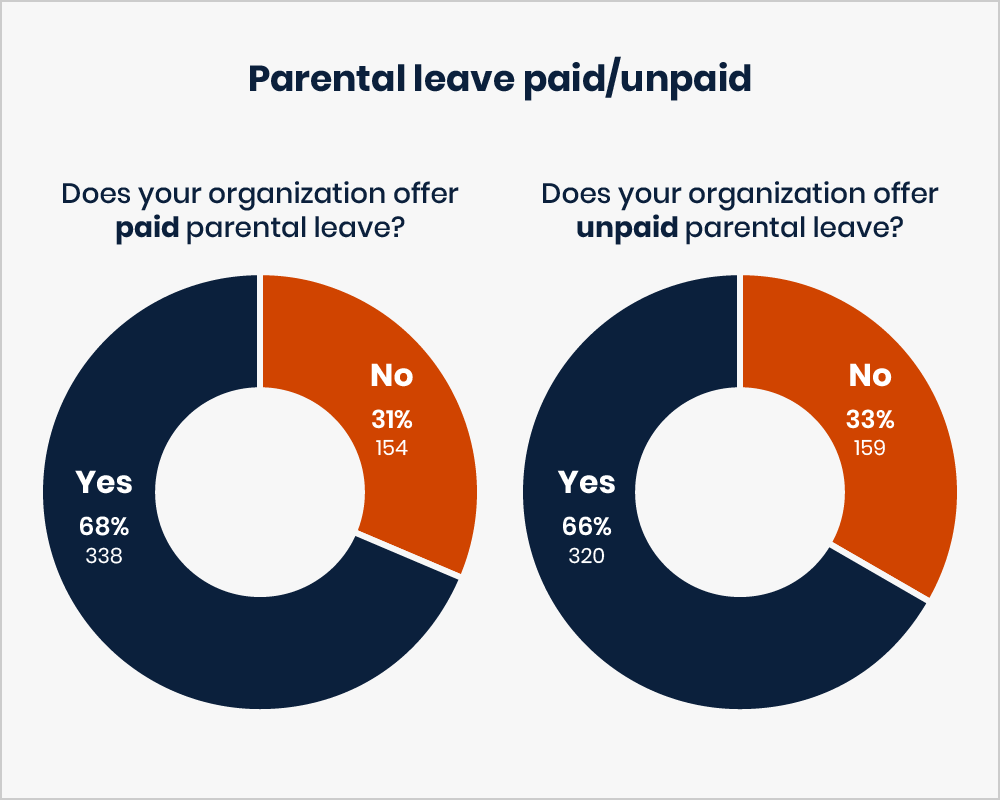
- Parental Leave
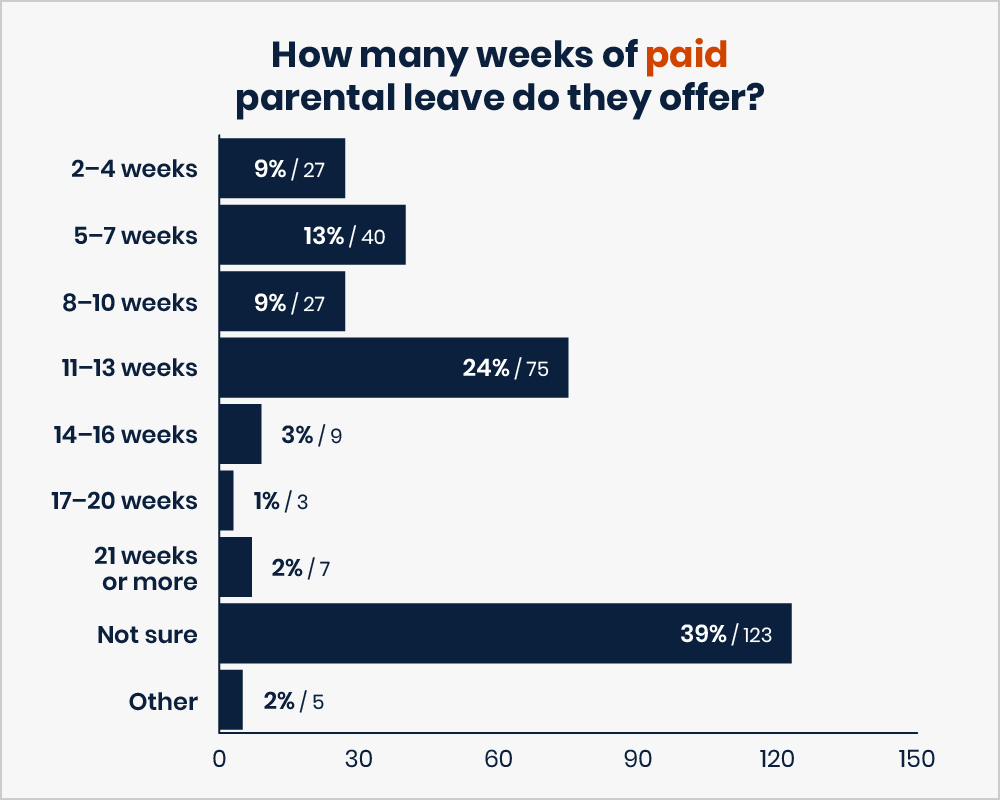
- Weeks of Paid Parental Leave
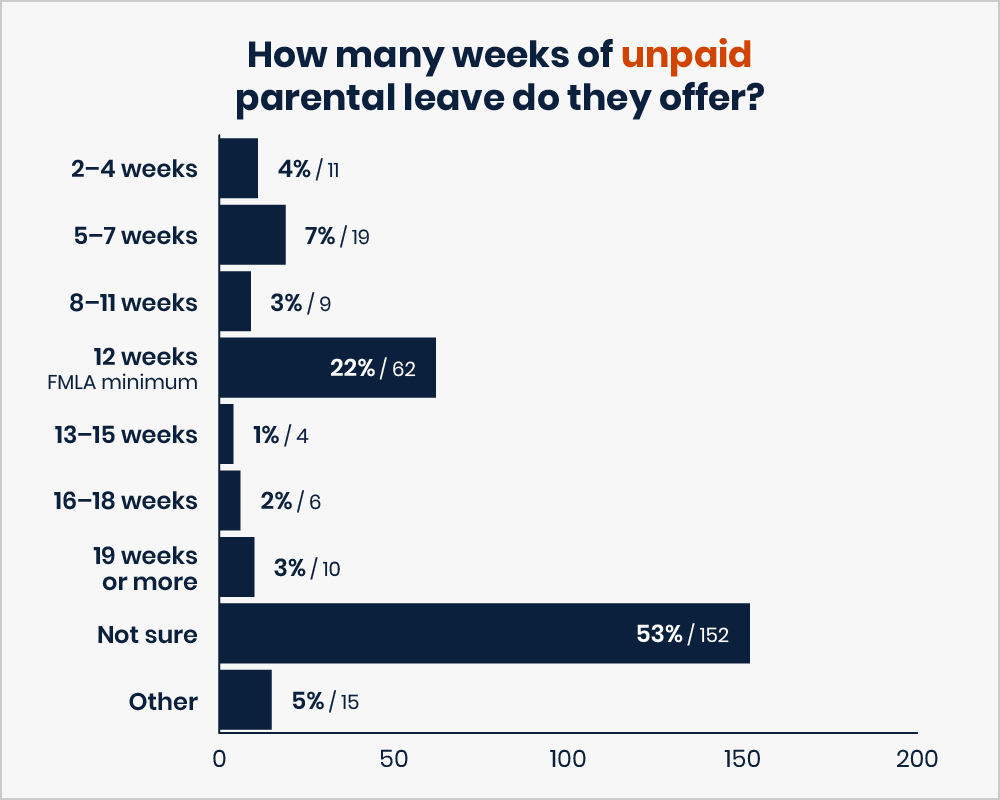
- Weeks of Unpaid Parental Leave
- Paid Parental Leave by Race
Unionizing

Most respondents report not having a union in their workplace, or not being eligible for union membership due to the nature of their job (e.g., being in management). Many state that they wish they had unions, and several elaborate on the reasons for the lack of union, including knowing that management is unfriendly to unionizing efforts, staff being too burned out to organize, or management deliberately squashing past unionizing efforts.
A significant minority of respondents shared their experience unionizing their workplace, and all except one shared that management deliberately fought unionizing efforts. This includes firing people for unionizing, intervening in the unionizing process to block progress, threatening to withhold employee benefits, and deliberately stalling unionizing efforts. Most report that the unionizing process took several years, and many original staff involved in unionizing efforts left or were fired from their jobs before the effort was complete.
Several share the benefits of union membership, including job protection, salary increases, and expansion of benefits. Some also share that they belong to a union but it’s weak, and therefore not a good advocate for employees.

“I am a member, it took almost 2 years to unionize and management pushed back heavily.”
“None of my repro jobs have ever had unions. We tried to create one while I was working in a clinic, but it was squashed quickly by management.”
“I have held two repro jobs at [organization], one was unionized, the other was not. I think the union translated to better benefits for all staff, even at the managerial level.”
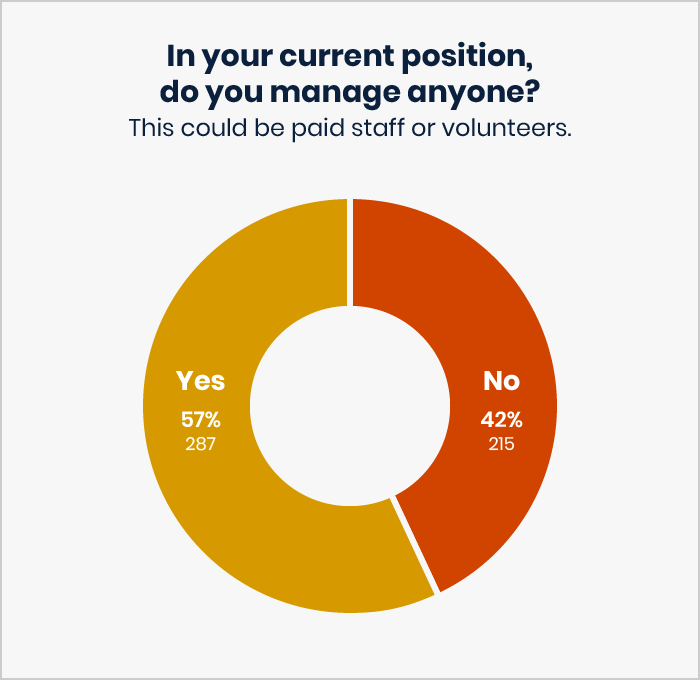
Management

Almost 80 people shared that they received training from The Management Center, with a majority of them saying that it was very helpful, particularly because the training integrates diversity and inclusion into management practices. Other types of management training cited includes the Rockwood Leadership Institute, internal training from other managers and HR departments, and coaching from consultants.
Even when they did receive management training, respondents say that there were few accountability mechanisms to ensure that managers followed through with the suggested protocols, and that training occurred so infrequently or only once, rendering it relatively useless. Several had suggestions for how to improve this, including regular training and evaluation for managers, and for executive teams to prioritize management training/evaluation as highly as they prioritize securing funding and programmatic work.

“Good management requires time and space, which I am not given.”
“I’m the one to hold myself accountable to being a good manager.”
“The training was done only after managers begged for it.”
Harassment
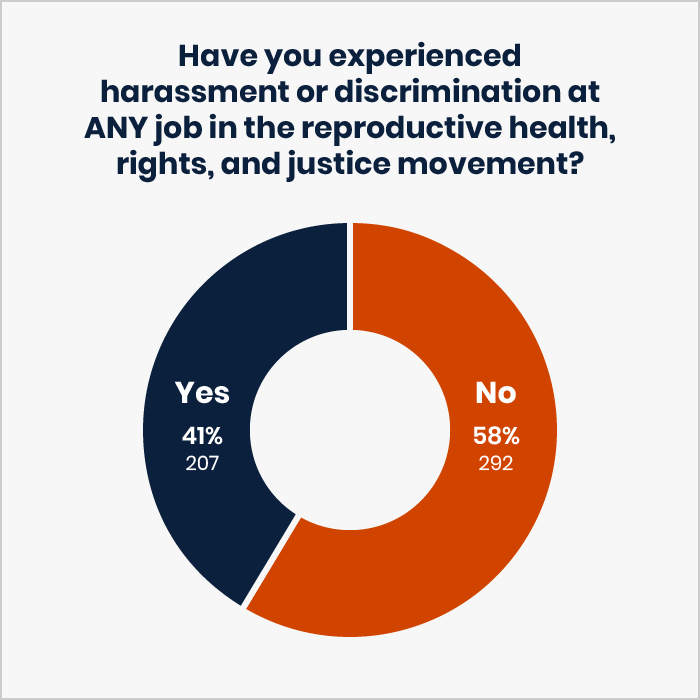
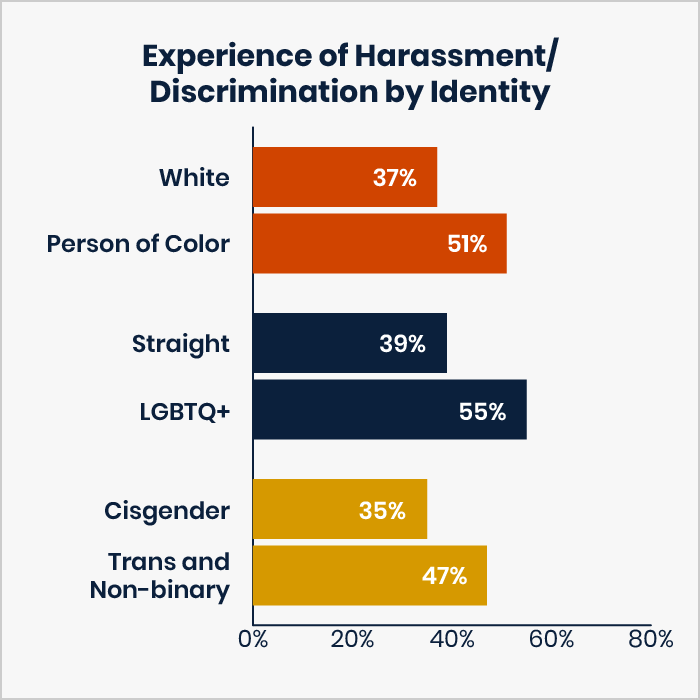
Respondents who indicated that they identify as people of color were more likely to report workplace harassment than white respondents. Similarly, employees who identified as a sexual minority or gender minority were also more likely to report workplace harassment than straight respondents or cisgender respondents.
About 1 in 2 Black respondents reported experiencing harassment. The same rate exists for Latinx respondents and multiracial respondents. About 1 in 3 white respondents reported experiencing harassment.
Participants reported experiencing many different forms of harassment:
Racism is the most frequently reported type of harassment. This includes behaviors such as: racist comments and jokes from superiors, from coworkers, and from donors, being passed over for promotions, making less money than white co-workers in the same jobs, being retaliated against for bringing up racist incidents, being told to solve the organization’s racial diversity issues, being tokenized, and many other incidents. About half of respondents reported these incidents to their Human Resources department, yet very few of their perpetrators faced any consequences.
Sexual harassment is the second most commonly reported type of abuse, and the overwhelming instance cited was inappropriate sexual comments from co-workers, senior colleagues, donors, and doctors. Every respondent who disclosed that they reported this to management or to Human Resources stated that they did not feel that they were taken seriously.
Respondents also report experiencing sexism at the workplace, including pay disparity based on sex, inappropriate comments from older male colleagues, board members, or donors, specifically targeting younger women, and disparaging comments about a woman's ability to do certain jobs (fundraising came up several times).
Respondents disclose experiences of bullying, including being yelled at by a supervisor in front of colleagues and donors, name-calling, verbal harassment, and throwing office supplies.
Transphobic incidents include asking inappropriate questions about an employee’s transition, refusing to acknowledge someone’s pronouns, generally transphobic comments, and being consistently misgendered by superiors.
Less frequently mentioned forms of harassment and discrimination included ageism, pregnancy discrimination, ableism, fatphobia, anti-Semitism, and homophobia.
Recommendations
Based on our findings, we recommend the following actions for reproductive health, rights, and justice organizational leadership:
Salaries & Benefits
Conduct a salary survey/scan of every position to ensure staff are paid equitably and according to the cost of living in their area, paying particular attention to race/ethnicity, age, gender identity, and sexuality, at the very least, and salary discrepancies.
Address and correct salary discrepancies that emerge as a result of the survey/salary scan. This reaffirms for staff that the organization is committed to equity not just in program work but in internal staff operations. Be clear with foundations and donors that operational expenses may increase as a result, and that investing in staff will strengthen the work of the organization.
Commit to salary transparency by putting salary ranges on every job description. Be clear about when there is, and is not, room for salary negotiation.
List the benefits your organization offers in the job description, including the number of weeks of paid and unpaid parental leave, the number of vacation and sick days, and types of professional development available.
Review your benefits to make sure they cover abortion, infertility care, gender confirmation care, etc. If they do not, provide a stipend to cover these costs so employees do not have to do so out of pocket.
Conduct periodic reviews comparing salaries and benefits at your organization to other nonprofits in your state.
Management
Standardize management training and provide it multiple times a year.
Provide a forum for managers to support each other and learn from each other.
Create a space for staff to provide anonymous and confidential feedback on their managers. Actually do something with this information, like using it to weed out toxic managers, provide areas of growth for managers to improve, and reward successful managers.
Provide managers with ongoing education about power, privilege, and identity in the workplace from organizations like the Management Center, the National Equity Project, and AORTA.
Harassment and Discrimination
Engage an independent consultant to determine staff understanding of and experiences with racism, sexism, homophobia, transphobia, ageism, ableism, and bullying at work. Actually commit to making change by putting resources into this as an ongoing project; this is not a one-time training or survey. This should happen yearly, at a minimum.
Provide extra support for staff and board members of color, for LGBTQ staff, for trans, genderqueer, and non-binary staff, and for staff with disabilities. For insights into what this support might look like, turn to resources such as the Race to Lead reports, the nonprofit Diversity Report, the Talent Justice Toolkit, the Woke at Work blog, and yes, your organization’s Glassdoor reviews. As brutal as they might be, people are often more honest when they can be anonymous. You might consider engaging an outside consultant to survey these staff members about what kind of support they need and commit to acting on the findings.
Provide extra training/education for white staff (especially leadership) and board members to enrich their understanding of racism and clearly explain repercussions for racist actions at work. Again, this is yearly, at the very least.
Take every complaint brought up by staff seriously. Follow through on independently investigating these complaints no matter what is going on politically or programmatically. Do so in a way that does not punish that person bringing the complaint. Follow up with staff about their complaint so they know it is being taken seriously and addressed, even when you cannot disclose details of the confidential process.
Many of these actions cannot occur without clear support in the form of significant additional funding and pressure from foundations. In recognition of that reality, we recommend the following actions for reproductive health, rights, and justice foundation donors:
Proactively provide funding for salary scan activities, a list of recommended consultants, and inquire about the changes grantees make as a result of the findings.
Conduct their own internal audits of grantee salaries and benefits by demographic factors, focusing specifically on race, ethnicity, sexuality, age, and gender identity at the very least. Have frank conversations with grantees about patterns and changes that need to occur in order for salaries to be equitable across demographic lines. Provide consequences for not following these requirements, including limiting funding.
Increase general support and operating funds so that organizations can cover management training, conflict management, continuous education and training on harassment and discrimination (with an emphasis on race/ethnicity, gender, and sexuality), specific support for people of color in the workplace, specific education/training for white people in the workplace, and other professional development for all staff.
Request information from organizational leadership about: how the organization handles interpersonal conflict and how the organization addresses harassment and discrimination complaints. Request data to back up what leadership tells you.
Review all personnel policies of grantees to determine if they are in line with the organization’s values. If they are not, provide funding and support for the organization to do so.
Provide additional funding for a human resources function at each organization you fund. Provide additional funding explicitly for benefits, especially paid parental leave, to bring the reproductive health, rights, and justice movement into the 21st century and requiring that organizations offer at least 24 weeks of leave. Provide funding for them to train and hire temporary staff to cover employee absences during this time.
Interface with staff, not just organizational leadership. If possible, uncover if the organizations you fund are union-busting, and do not tolerate this behavior.
